


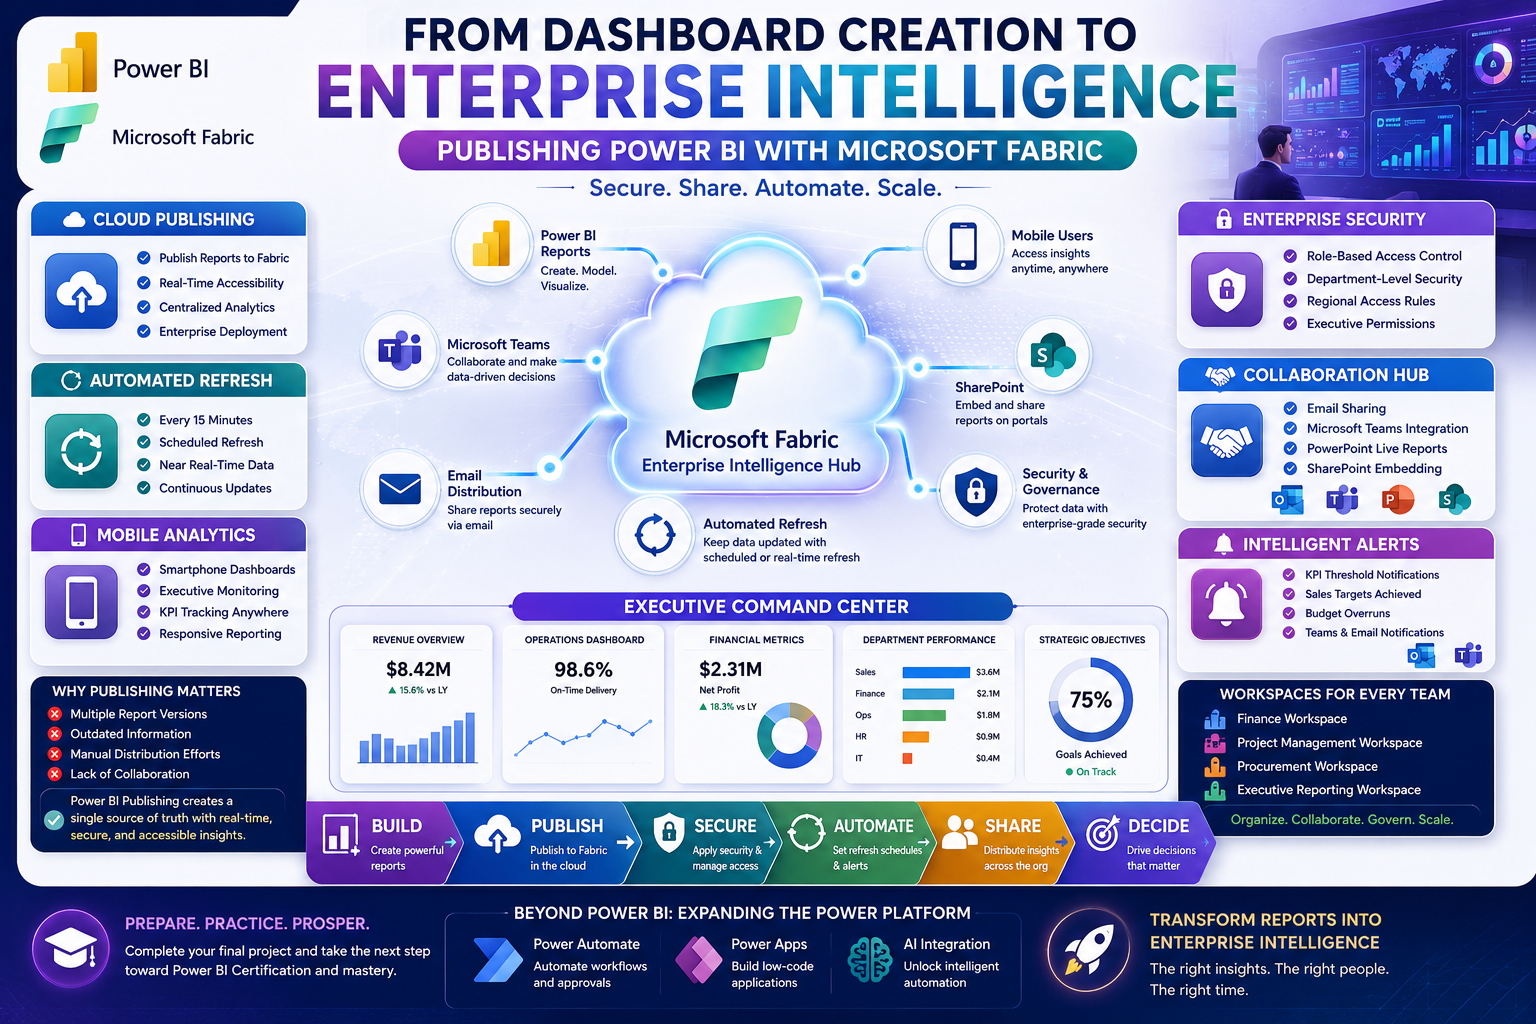
Creating a dashboard is only half the journey. The real value of Business Intelligence begins when insights are securely shared with the right people at the right time.
In this Power BI session, participants explored the world of Microsoft Fabric and Power BI Publishing, learning how organizations distribute reports, automate refreshes, manage security, and empower executives with real-time analytics.
The class bridged the gap between dashboard development and enterprise deployment—an essential skill for modern Business Intelligence professionals.
🚀 Bringing Reports to Life in the Cloud
Once a Power BI report is completed, organizations need a reliable way to distribute insights across teams and departments.
Participants learned how Power BI reports can be published to the cloud using Microsoft Fabric, enabling users to:
✅ Access reports anywhere
✅ Collaborate across departments
✅ Share insights securely
✅ Enable mobile access
✅ Deliver real-time intelligence
Cloud publishing transforms static reports into dynamic business solutions that continuously deliver value.
📊 Why Publishing Matters
Many organizations struggle with disconnected reports being shared through email attachments.
This often leads to:
❌ Multiple report versions
❌ Outdated information
❌ Manual distribution efforts
❌ Lack of collaboration
Power BI Publishing addresses these challenges by creating a centralized source of truth where stakeholders access the latest information in real time.
👥 Secure Report Sharing Across the Organization
One of the key topics covered was report sharing and collaboration.
Participants explored multiple sharing methods including:
📧 Email Sharing
Send report access directly to stakeholders.
💬 Microsoft Teams Integration
Embed reports within team channels for collaboration.
📽️ PowerPoint Integration
Present live dashboards during executive meetings.
🌐 SharePoint Embedding
Display reports directly on intranet portals.
These capabilities allow organizations to bring analytics into the tools employees already use every day.
🔒 Role-Based Security for Enterprise Reporting
Security remains a critical requirement for any Business Intelligence solution.
The session introduced Role-Based Access Control (RBAC) and data security concepts that allow organizations to:
-
Restrict access by department
-
Limit visibility by region or country
-
Control executive access levels
-
Protect sensitive business information
For example:
📌 Finance teams may see financial data only.
📌 Regional managers may access data for their territories.
📌 Executives may view organization-wide KPIs.
This ensures users see only the information relevant to their responsibilities.
🔄 Automating Data Refresh
A dashboard is valuable only when its data remains current.
Participants learned how Microsoft Fabric enables automated refresh schedules that keep reports updated without manual intervention.
Refresh frequencies can range from:
⏱ Every 15 Minutes
📅 Daily Updates
⚡ Near Real-Time Intelligence
Depending on business needs and infrastructure, organizations can create reporting environments that continuously reflect operational changes.
📱 Business Intelligence Anywhere with Mobile Access
Today's executives require access to insights wherever they are.
The session demonstrated how Power BI reports can be accessed through mobile applications, enabling users to:
✅ View dashboards on smartphones
✅ Monitor KPIs on the go
✅ Zoom into visualizations
✅ Switch to landscape mode for presentations
This mobility ensures decision-makers remain connected to critical information anytime and anywhere.
🔔 Intelligent Alerts and Notifications
Modern dashboards don't just display information—they actively notify users when action is needed.
Participants explored how to configure alerts for KPI thresholds such as:
-
Sales targets achieved
-
Budget overruns
-
Inventory shortages
-
Performance milestones
Notifications can be delivered through:
💬 Microsoft Teams
This transforms dashboards from passive reports into proactive business tools.
📌 Creating Executive Dashboards
One of the most exciting features introduced was dashboard creation through visual pinning.
Instead of reviewing multiple reports separately, executives can create a centralized dashboard by pinning key visuals from different reports into a single view.
Benefits include:
✔ Unified business visibility
✔ Faster decision-making
✔ Cross-functional insights
✔ Improved executive reporting
A well-designed executive dashboard becomes a strategic command center for the organization.
🏢 Organizing Reports with Workspaces
Participants also learned how organizations structure content using workspaces.
Workspaces help teams:
-
Organize reports by department
-
Manage permissions efficiently
-
Collaborate securely
-
Maintain governance standards
Examples include:
📊 Finance Workspace
🏗️ Project Management Workspace
🛒 Procurement Workspace
📈 Executive Reporting Workspace
This structure improves scalability as reporting environments grow.
🎓 Preparing for Certification & Final Projects
As the training program progresses, participants are encouraged to complete and submit their final projects.
These projects demonstrate skills in:
✅ Data Preparation
✅ Data Modeling
✅ DAX Calculations
✅ Dashboard Design
✅ Publishing & Sharing
Successful completion represents an important milestone toward Power BI certification and practical business intelligence expertise.
🚀 Beyond Power BI: Expanding the Power Platform
Participants also received a preview of upcoming sessions covering:
⚙️ Power Automate
Automating business workflows and approvals.
📱 Power Apps
Building low-code applications.
🤖 AI Integration
Exploring intelligent automation opportunities.
These capabilities extend analytics into broader digital transformation initiatives.
🌟 Key Takeaways from the Session
Participants learned how to:
✔ Publish reports to Microsoft Fabric
✔ Share reports securely
✔ Configure Role-Based Access Control
✔ Set up automated refresh schedules
✔ Enable mobile reporting
✔ Create executive dashboards
✔ Integrate reports with Teams and SharePoint
✔ Configure intelligent alerts
These skills are essential for deploying enterprise-ready Business Intelligence solutions.
🎯 Why Publishing Skills Matter
Creating dashboards is valuable.
Deploying dashboards that drive decisions is transformational.
Professionals who understand:
📊 Business Intelligence
☁️ Cloud Analytics
🔒 Data Security
⚡ Automation
📱 Mobile Reporting
🤝 Collaboration
are increasingly sought after across industries.
The future of analytics is not only about building reports—but ensuring the right people receive the right insights at the right time.
🚀 Continue Your Power BI Journey with Team Academy
At Team Academy, we focus on practical, hands-on learning designed to prepare professionals for real business challenges.
Learn How To:
✅ Build Professional Dashboards
✅ Publish Enterprise Reports
✅ Automate Data Refresh
✅ Secure Business Data
✅ Deliver Actionable Insights
Your journey from data to decision-making continues here.
📩 Join Team Academy and transform the way your organization uses data.


