


Behind every great dashboard lies clean, structured, and reliable data.
In this Power BI training session, participants explored the core concepts of Power Query using the Northwind Traders case study. The class focused on transforming raw data into analytics-ready datasets—an essential skill for every Business Intelligence professional.
From loading CSV files to mastering unpivoting techniques, learners gained practical experience in preparing data for reporting, visualization, and decision-making.
🚀 Why Data Preparation Matters
Organizations generate vast amounts of data every day.
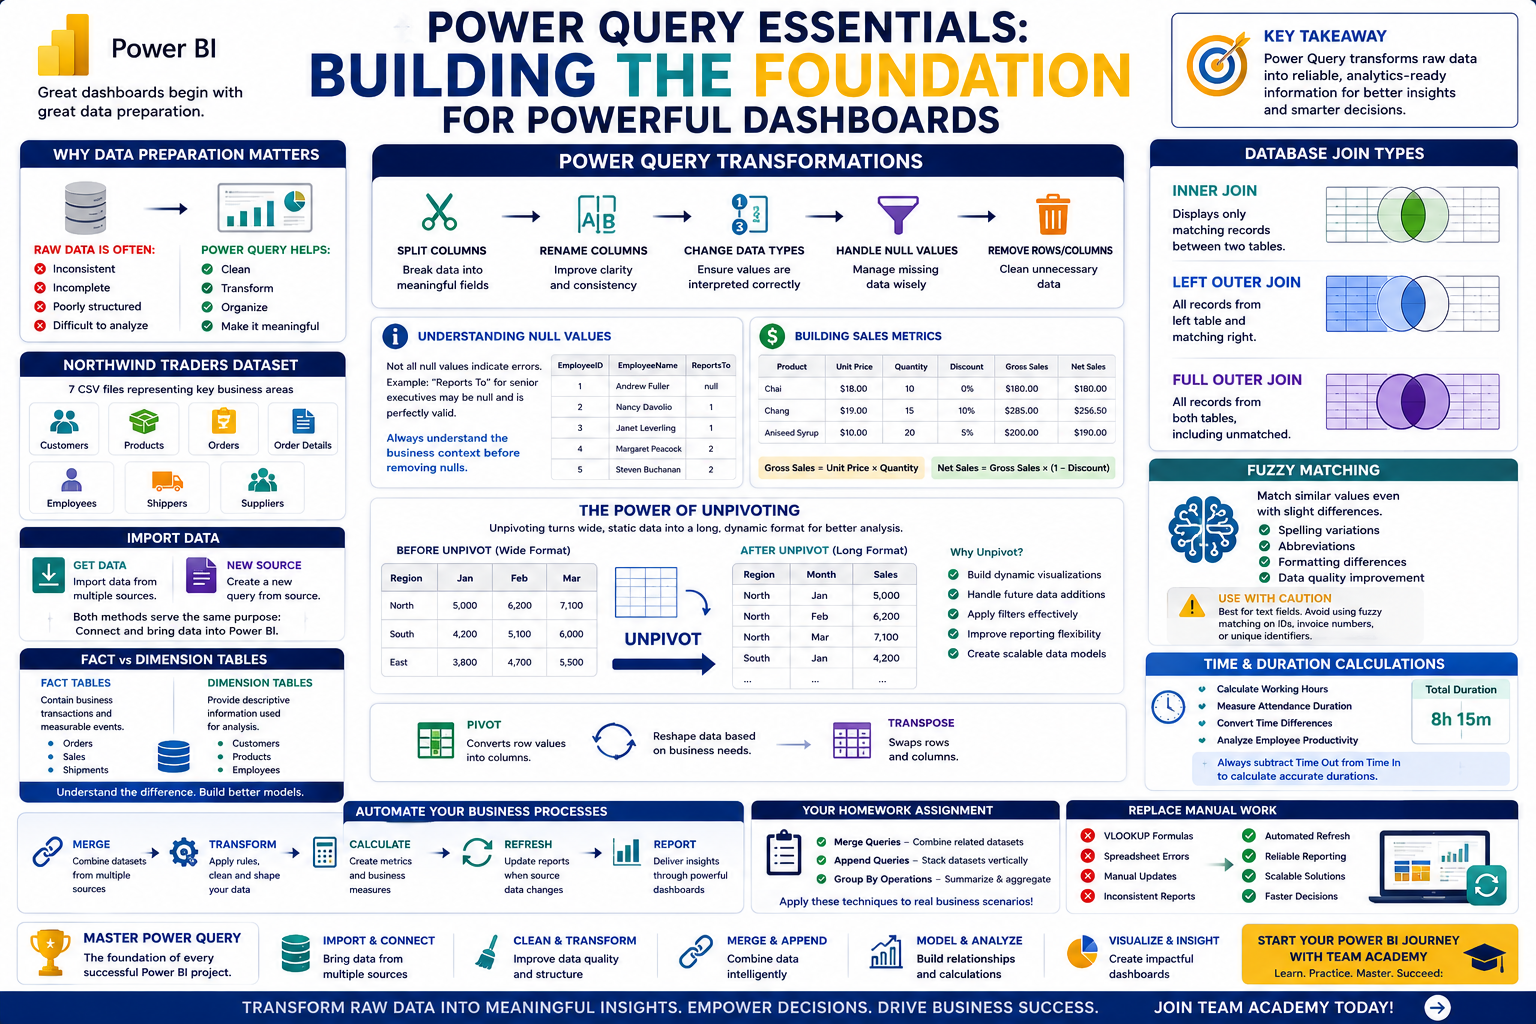
However, raw data is often:
❌ Inconsistent
❌ Incomplete
❌ Poorly structured
❌ Difficult to analyze
Power Query helps transform this raw information into meaningful insights by enabling users to clean, shape, and organize data before building reports.
The session reinforced an important principle:
Great dashboards begin with great data preparation.
📂 Working with Multiple Data Sources
Participants worked with the Northwind Traders dataset, consisting of seven CSV files representing different areas of business operations.
Examples included:
-
Customer information
-
Product details
-
Orders
-
Shipments
-
Employee data
Learners practiced importing these datasets into Power BI using both Get Data and New Source, discovering that both functions serve the same purpose.
This exercise highlighted how organizations often work with multiple data sources that need to be integrated for comprehensive reporting.
🏗️ Understanding Fact and Dimension Tables
One of the foundational topics covered was the distinction between fact and dimension tables.
📈 Fact Tables
Contain business transactions and measurable events.
Examples:
-
Orders
-
Sales
-
Shipments
📋 Dimension Tables
Provide descriptive information used for analysis.
Examples:
-
Customers
-
Products
-
Employees
Understanding this distinction is critical for building scalable data models and preparing for Power BI certification.
🔄 Transforming Data with Power Query
Participants explored several transformation techniques commonly used in real-world projects.
These included:
✂️ Splitting Columns
Separating data into meaningful fields.
📝 Renaming Columns
Improving clarity and consistency.
🔢 Changing Data Types
Ensuring values are interpreted correctly.
🧹 Handling Null Values
Managing missing information without compromising analysis.
The session emphasized that effective transformation leads to cleaner data and more reliable insights.
⚠️ Understanding Null Values
Missing data is a common challenge in analytics.
Participants learned that not all null values indicate errors.
For example:
-
A "Reports To" field for senior executives may legitimately contain null values.
Rather than deleting all missing values, analysts must understand the business context before making data-cleaning decisions.
This approach ensures that valuable information is not accidentally removed.
💰 Building Sales Metrics
The class introduced practical calculations used in business reporting.
Participants created:
Gross Sales
Calculated as:
Unit Price × Quantity
Net Sales
Calculated by applying discounts:
Gross Sales × (1 – Discount)
These calculations demonstrate how Power Query can be used to create business metrics before data reaches the reporting stage.
Participants also explored rounding functions and decimal handling to improve data consistency.
📊 The Power of Unpivoting
One of the most important lessons of the session focused on Unpivoting.
The instructor emphasized that unpivoting is not optional—it is often essential for proper data modeling in Power BI.
Why Unpivot?
Imagine a dataset where months are stored as separate columns:
JanFebMar
While this format may look convenient in Excel, it creates challenges for analytics.
After unpivoting, the data becomes:
MonthSalesJan5000Feb6200Mar7100
This structure allows Power BI to:
✅ Build dynamic visualizations
✅ Handle future data additions
✅ Apply filters effectively
✅ Improve reporting flexibility
Unpivoting transforms static spreadsheets into scalable analytical models.
🔄 Understanding Pivot and Transpose
Participants were also introduced to related transformation techniques:
Pivot
Converts row values into columns.
Transpose
Swaps rows and columns.
These operations are useful in specific scenarios and help analysts reshape data based on business requirements.
Together with unpivoting, these techniques form a powerful toolkit for data preparation.
📚 Preparing for PL300 Certification
The session reinforced that mastering Power Query is a key requirement for the PL300 Microsoft Power BI Certification.
Participants learned that successful Power BI professionals should understand seven essential Power Query concepts, including:
✔ Data Importing
✔ Data Cleaning
✔ Data Transformation
✔ Appending
✔ Grouping
✔ Merging
✔ Unpivoting
These skills form the foundation of Business Intelligence development.
🚀 Practice Makes Perfect
Participants were encouraged to continue practicing using the provided case studies and datasets.
Hands-on exercises remain the fastest path to mastering:
-
Data transformation
-
Modeling
-
Reporting
-
Dashboard creation
The ability to solve real business problems through data is what distinguishes analysts from dashboard users.
🎯 Why Power Query Skills Matter
Organizations increasingly rely on professionals who can:
📊 Prepare and transform data
🔄 Automate repetitive processes
🏗️ Build scalable models
📈 Deliver business insights
⚡ Support data-driven decisions
Power Query remains one of the most valuable and in-demand skills in the world of analytics and Business Intelligence.
🌟 Continue Your Analytics Journey with Team Academy
At Team Academy, we believe that learning by doing is the key to mastering technology.
Learn How To:
✅ Master Power Query
✅ Build Data Models
✅ Create KPIs with DAX
✅ Design Interactive Dashboards
✅ Deliver Executive Insights
Join Team Academy and transform raw data into business value.
📩 Start your journey toward becoming a Power BI professional today.


