


As the Power BI training program approaches its final stages, participants explored advanced visualization techniques that transform reports into interactive, executive-ready business intelligence solutions.
This session focused on enhancing dashboard functionality through Role-Level Security (RLS), dynamic parameters, visual calculations, custom visuals, and advanced DAX measures. Participants gained practical experience using the Northwind Traders dataset while learning techniques commonly used in enterprise reporting environments.
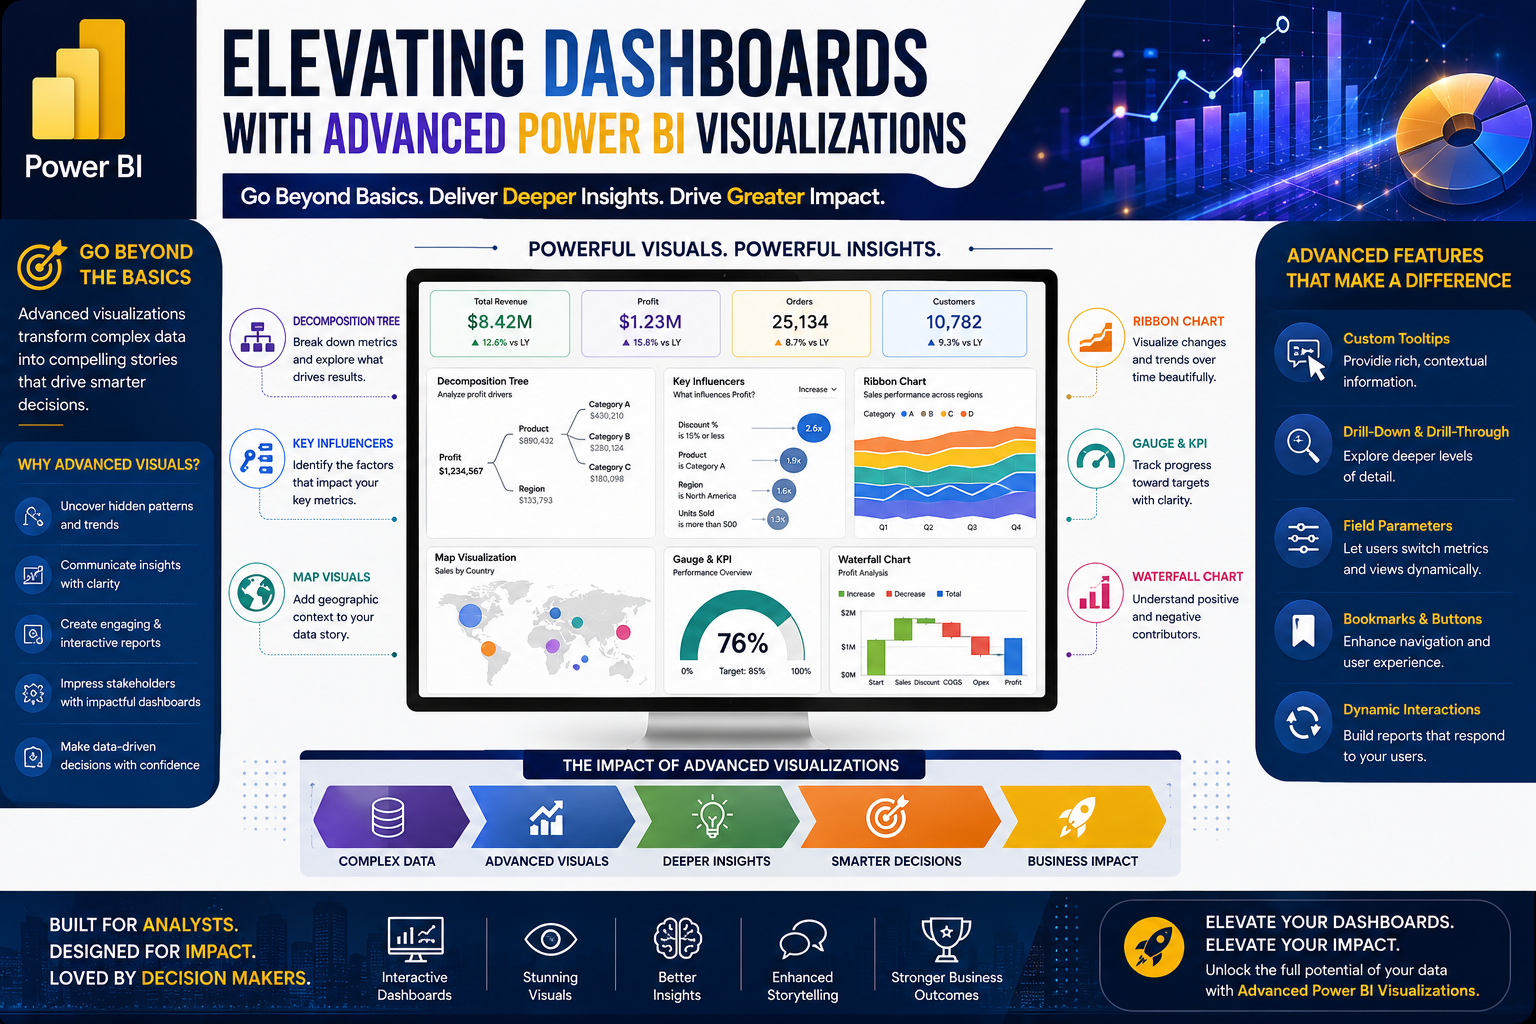
🚀 Moving Beyond Basic Dashboards
Creating charts is only the beginning of successful reporting.
Modern business intelligence solutions require:
✅ Interactive user experiences
✅ Personalized data access
✅ Dynamic reporting capabilities
✅ Advanced performance metrics
✅ Executive-level visual storytelling
The session demonstrated how Power BI enables organizations to move from static reports to intelligent, user-driven dashboards.
🔒 Role-Level Security (RLS): Delivering the Right Data to the Right People
One of the key topics covered was Role-Level Security (RLS), an essential feature for enterprise reporting.
Participants learned how organizations can:
-
Restrict access to specific datasets
-
Control visibility by country, department, or business unit
-
Create customized user experiences
-
Maintain data governance and compliance
Practical exercises demonstrated how security roles can be configured and tested before deployment.
Business Benefits of RLS
✔ Enhanced data security
✔ Controlled access to sensitive information
✔ Improved compliance and governance
✔ Personalized reporting experiences
⚡ Dynamic Parameters for Interactive Reporting
The class introduced dynamic parameters, a powerful feature that allows users to change report perspectives instantly.
Instead of building multiple charts, users can dynamically switch between dimensions such as:
-
Country
-
Employee
-
Product Category
-
Customer Segment
This creates highly flexible dashboards while reducing development time.
Participants practiced creating parameter-driven visuals that automatically adjust based on user selections.
📈 Visual Calculations and Running Totals
The session explored Power BI's visual calculation capabilities.
Participants learned how to:
-
Create running totals
-
Calculate cumulative performance
-
Compare trends over time
-
Analyze business growth patterns
These calculations help decision-makers quickly identify trends and performance trajectories without requiring additional report pages.
🧠 Strengthening DAX Skills
Building on previous sessions, learners continued developing DAX (Data Analysis Expressions) expertise.
Topics included:
Quick Measures
Fast calculation creation without extensive coding.
Filtered Values
Applying business-specific filters to KPIs.
Performance Metrics
Creating measures for evaluating operational effectiveness.
Time Intelligence
Analyzing data across different periods and trends.
The class reinforced the importance of understanding business logic rather than simply memorizing formulas.
⭐ Performance Metrics and Rating Systems
A practical exercise involved creating performance scorecards using star ratings.
Participants learned how to:
-
Measure employee performance
-
Create KPI thresholds
-
Assign rating scales
-
Visualize achievement levels
These techniques are frequently used in sales, customer service, operations, and project management dashboards.
🎨 Exploring Custom Visuals
One of the most engaging sections of the session focused on Power BI's extensive visual marketplace.
Participants explored custom visuals including:
News Scrollers
Ideal for announcements and key updates.
Animated Bar Race Charts
Useful for visualizing changes over time.
Interactive Performance Visuals
Designed to improve user engagement.
The session emphasized that while custom visuals can enhance reports, they should be used strategically to support business understanding rather than distract from insights.
📊 Building Meaningful Dashboards
The training emphasized that successful Power BI professionals focus on solving business problems—not simply creating attractive reports.
Participants were encouraged to:
✔ Understand business objectives
✔ Design dashboards around decision-making needs
✔ Prioritize clarity over complexity
✔ Create reports that drive action
This mindset is what separates dashboard developers from business intelligence professionals.
🎓 Preparing for Final Project Submission
As the program nears completion, participants were reminded to finalize and submit their Power BI projects.
The final project serves as an opportunity to demonstrate:
-
Data preparation skills
-
Data modeling techniques
-
DAX calculations
-
KPI development
-
Dashboard design
-
Visualization best practices
Successful project completion is a key milestone toward certification.
🚀 Special Learning Sessions Ahead
Several special sessions have been scheduled to expand participants' Power Platform knowledge.
Upcoming topics include:
🌐 Power BI Publishing & Fabric
Publishing and sharing reports securely.
⚙️ Power Automate
Automating business workflows and processes.
📱 Power Apps
Creating low-code business applications.
🤖 Copilot for Excel
Leveraging AI to improve productivity and analysis.
These sessions provide additional opportunities for learners to expand their digital transformation capabilities beyond traditional reporting.
🌟 Key Takeaways from This Session
Participants learned how to:
✅ Configure Role-Level Security (RLS)
✅ Build Dynamic Parameter-Based Reports
✅ Create Running Totals and Visual Calculations
✅ Develop KPI and Rating Systems
✅ Implement Custom Visuals
✅ Enhance Dashboard Interactivity
✅ Prepare Enterprise-Ready Reports
🎯 Why Advanced Visualization Matters
Organizations increasingly depend on dashboards to make strategic decisions.
Professionals who can combine:
📊 Data Analysis
📈 Business Intelligence
⚡ Automation
🎨 Visualization Design
🔒 Data Governance
are among the most sought-after talent in today's data-driven economy.
The ability to build dashboards that are secure, interactive, and insightful creates significant value for any organization.
🚀 Continue Your Power BI Journey
At Team Academy, we focus on practical skills that help professionals build real-world business intelligence solutions.
Learn How To:
✅ Build Professional Dashboards
✅ Master DAX & KPIs
✅ Implement Security & Governance
✅ Create Advanced Visualizations
✅ Deliver Actionable Business Insights
Your journey from data to decision-making is just getting started.


